查询长时间不返回
1 | select * from information_schema.processlist;//这条语句跟下面的语句相同 |
特殊的,在模拟一种MDL写锁阻塞的情况可以通过该命令查到阻塞的查询,这种情况一般第一时间执行该语句:
通过kill指令杀掉线程,恢复执行:
1 | kill 4;//kill pid,通过上面的命令查询到可以查询到对应线程的pid |
1 | select * from information_schema.innodb_locks;//可以查看死锁,注意锁等待信息不会在这里显示出来,除非发生死锁。包括gap锁和x锁可能导致的死锁等待,数据库开启了死锁等待机制可以检测死锁。 |
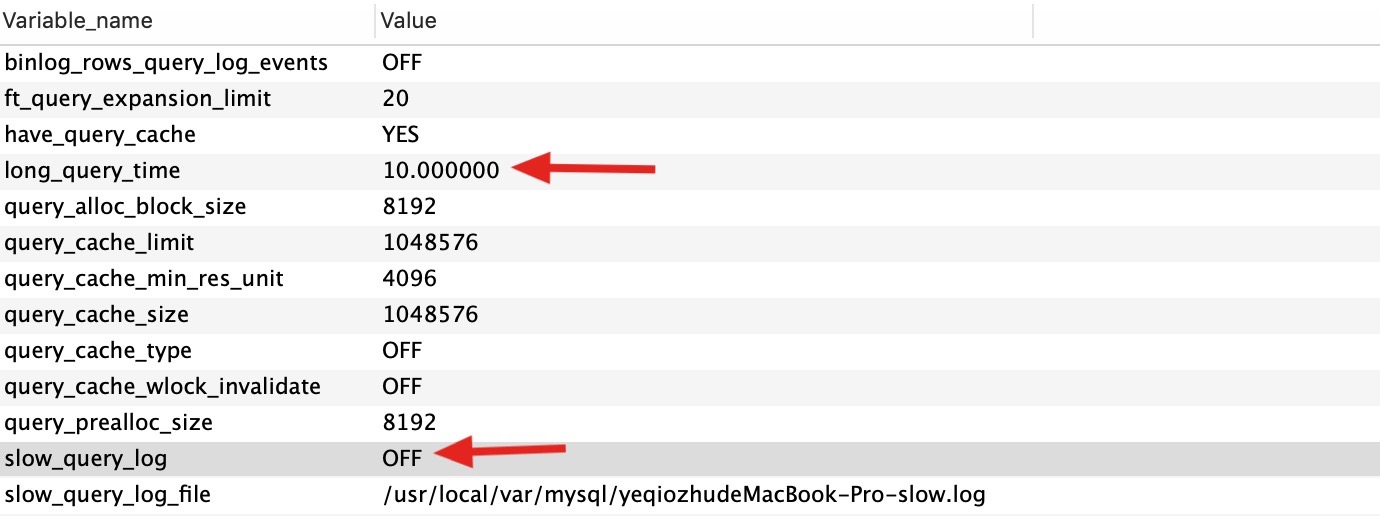
开启慢查询
1 | show variables like "%query%" |
result:
1 | -- 会在当前session立即生效 |
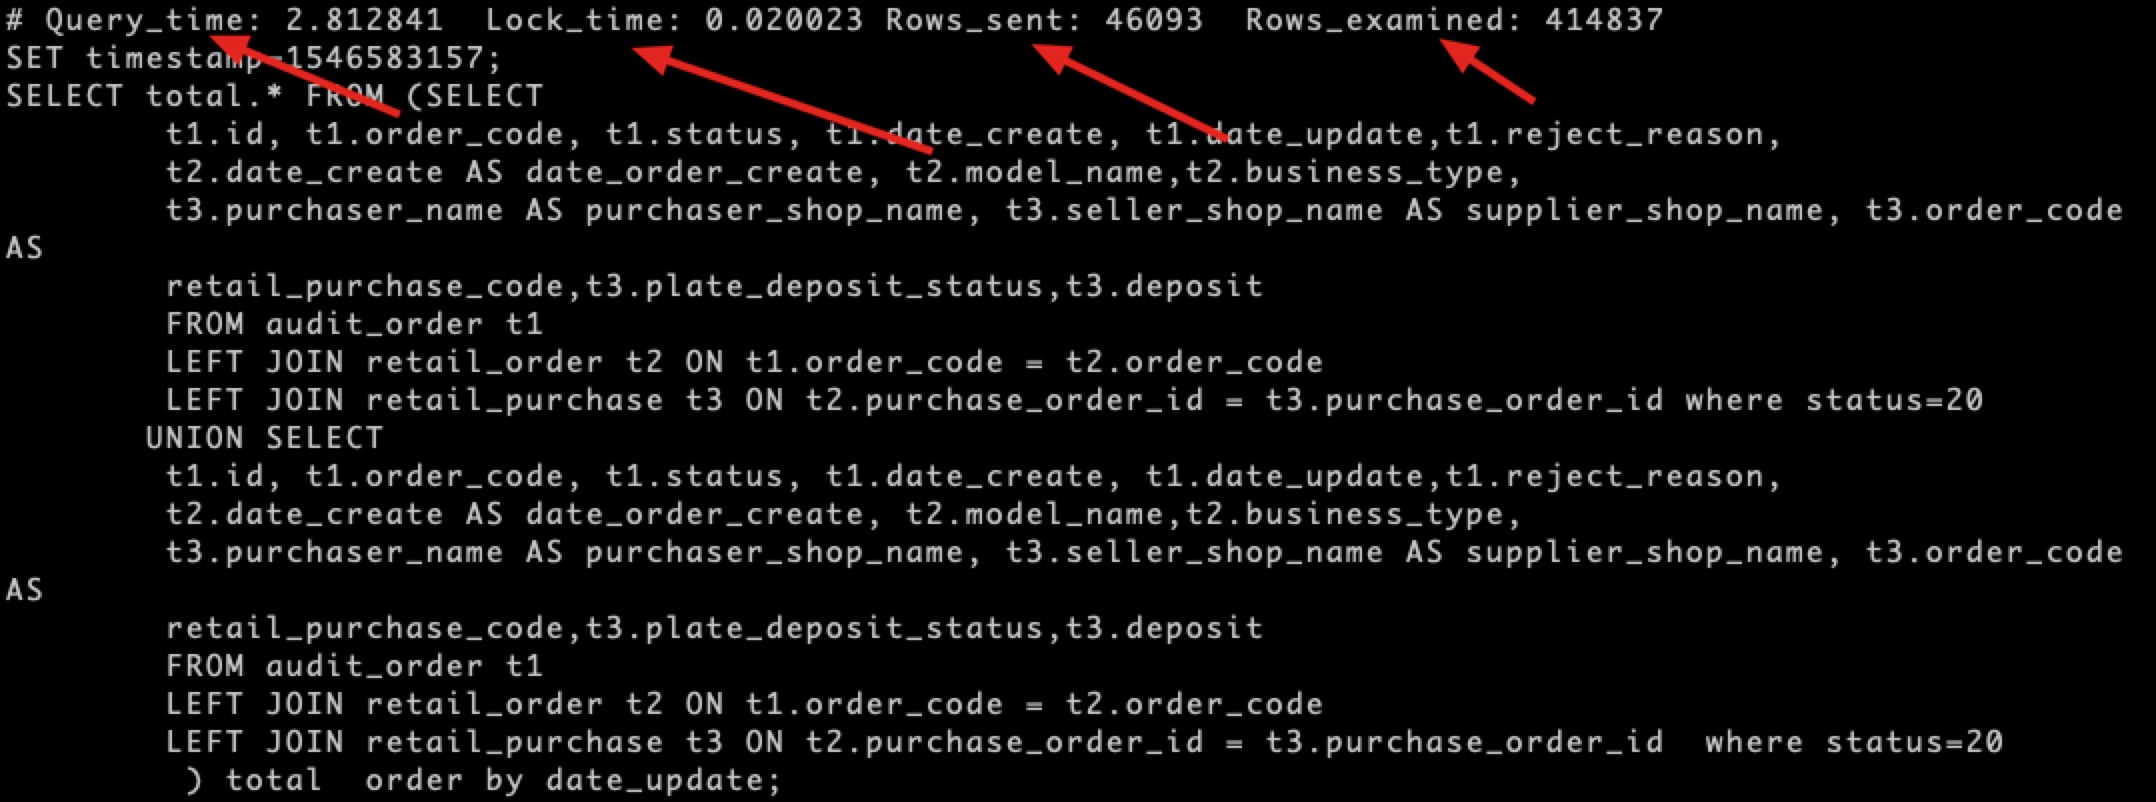
截取一个slow log的记录结果:
慢查询优化步骤
业务上有个审核表的表结构如下:
1 | CREATE TABLE `audit_order` ( |
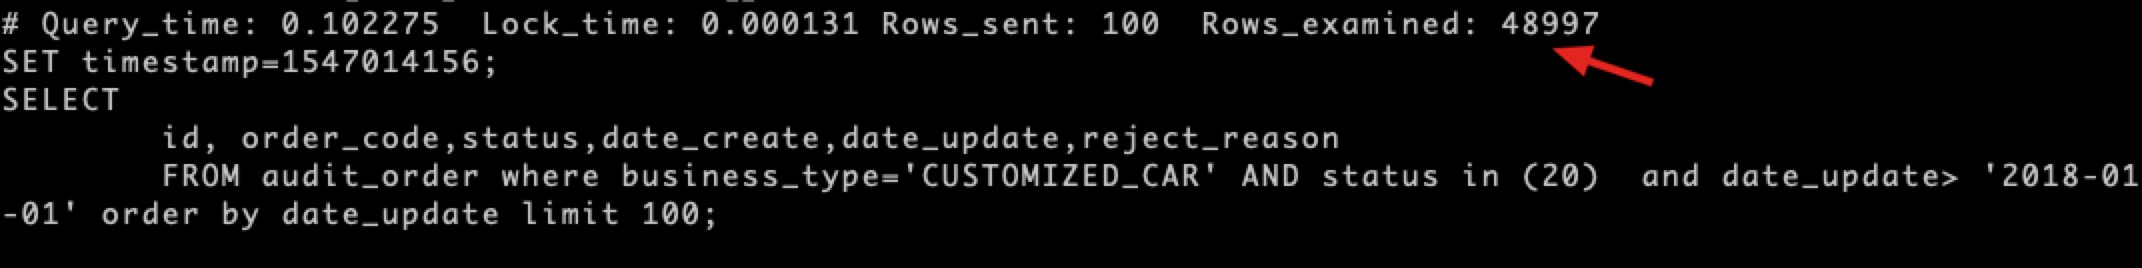
分析下面语句实际扫描的行数:
1 | SELECT id, order_code, status, date_create, date_update |
我们explain一下:

这里分析显示的扫描行数rows是24786行,但是实际上我们通过慢查询日志发现,实际的扫描行数是接近五万行,接近两倍。using index condition表示通过date_update索引查询过滤到记录之后回表,执行时间在全表数据较少的情况下用了100ms,符合我们的预期:
加一个索引,重新执行explain,并观察慢查询日志真实扫描行数:
1 | ALTER TABLE audit_order |

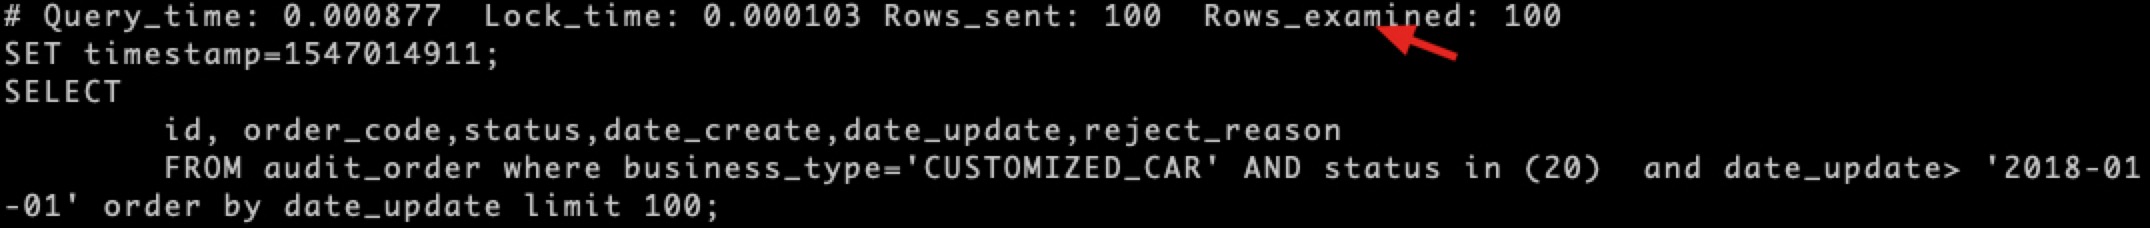
通常我们观察range级别是索引可用级别,但是实际的扫描行数还是需要参考explain的rows和日志中的rows_examinzed,其中explain是估计值,真正准确的还是rows_examinzed。
count(*)性能
innnodb在统计行数的时候没有像myisam一样保存了行数,需要重新扫描一遍表。我们比较一下集中查询方式的性能。插入一个两百多万行的数据表word。
1 | DELIMITER ;; |
1 | -- count(id) |
结论:count(*)约等于count(1)>count(id)>count(字段),推荐使用前三个,count字段有磁盘io,会把字段的值取出来,进行判断是否为null值。通常我们通过innodb的事务性特征,将总记录条数在一个事务中去取,mysql即使在异常情况下也不会导致数据不一致。